Which Website Analytics Should I Track?
Many small businesses and creatives who have a website aren’t using analytics to make their websites better. Website analytics are one of the most straightforward ways to understand your audience, improve your website, and grow your business. So what exactly are website analytics, and how do you know which website analytics to track?
What are Website Analytics?
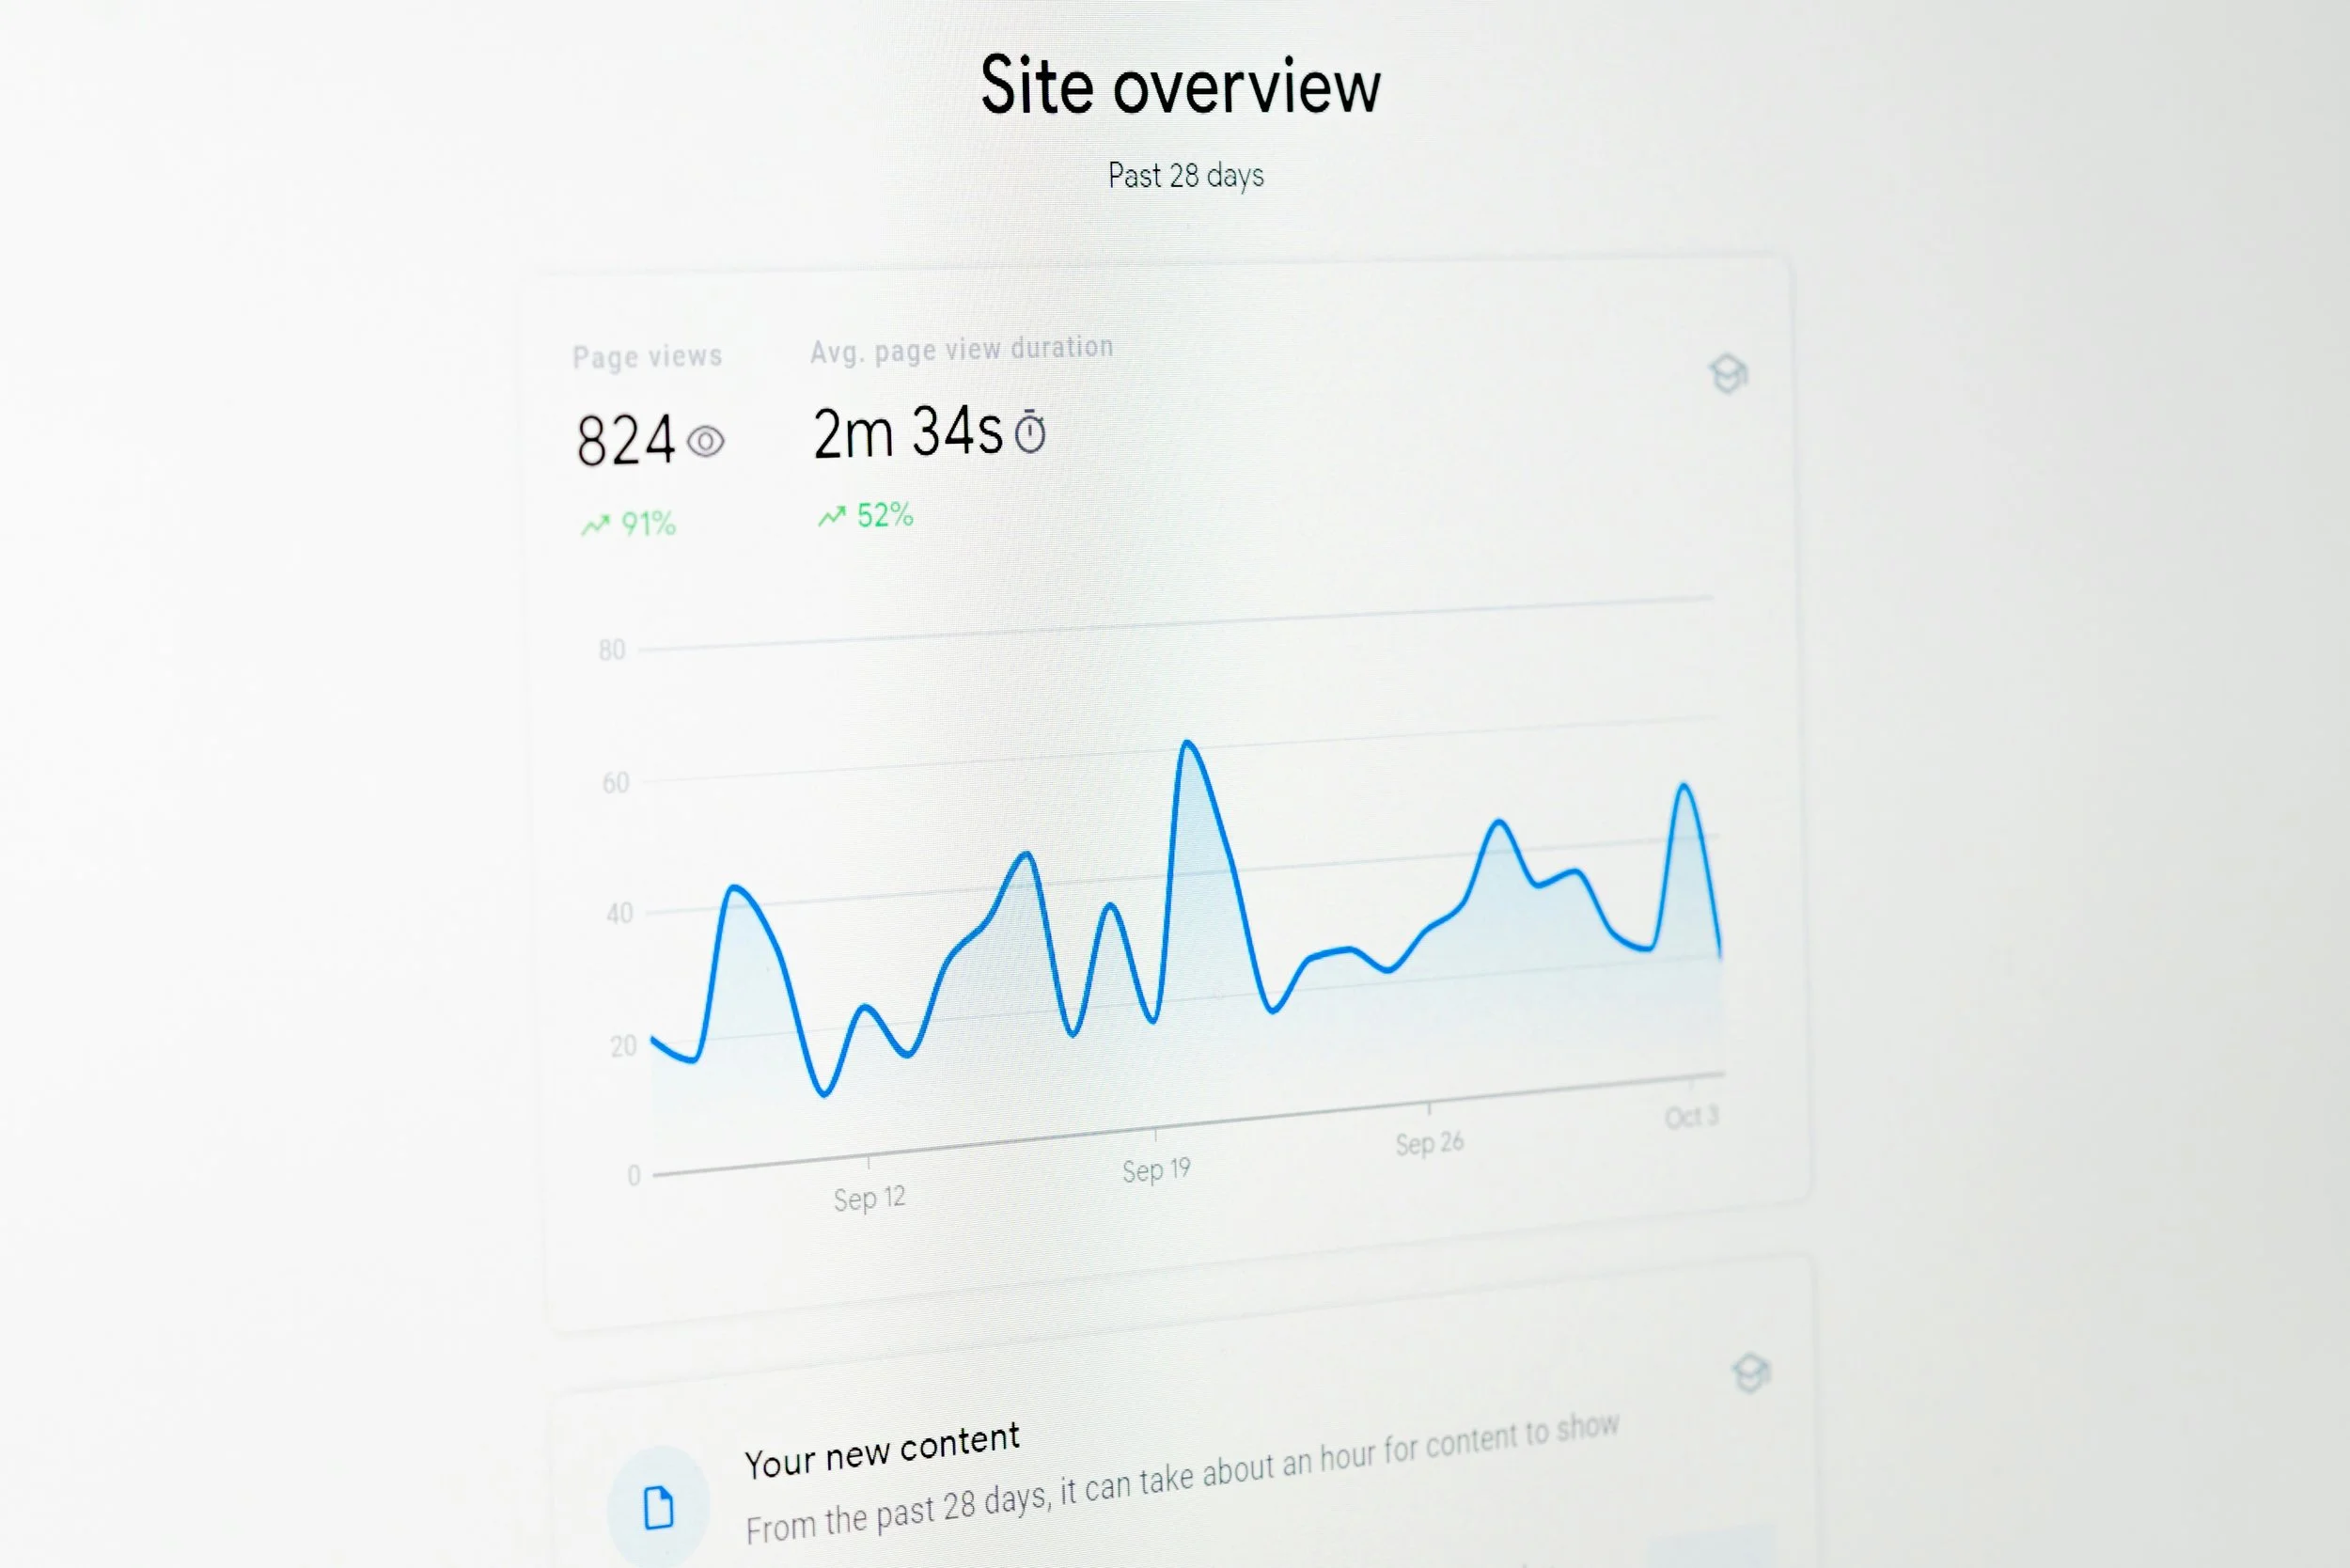
Website Analytics is the process of collecting and processing data about how visitors use your website. It shows which pages people spend the most time on, which pages they leave, what buttons they click or forms they fill out, and how they move around your site. You can use that data to simplify menus, highlight high-performing content, or redesign pages that aren’t working well for you. Using your analytics to inform your website design can improve it.
Key Metrics to Track:
There are three main types of metrics to track. They each give different information about your website’s performance.
Traffic Metrics
Traffic metrics show who is coming to your site and how they found you. Low numbers could mean that there are marketing or SEO issues with your site, while strong numbers show your outreach is working well. Important traffic metrics include:
Visits/Sessions: Total visitors to your site. Multiple visits from the same user are all tracked as separate visits.
Unique Visitors: Number of individual people who visit your website. These are counted only once, even if they leave the website and return or visit more than one page. The website uses browser cookies or IP addresses to check that it is the same user returning.
Pageviews: How many times each page was viewed.
Traffic Sources: Whether visitors came from search engines, social media, email or direct links. Common traffic sources include Organic Search, Paid Search, Social Media, Referral, Email Marketing, or Direct Traffic
Traffic by Device: What device a user is using to access your site (Desktop, mobile, or tablet)
Traffic by Location: Where your visitors are based. This can be helpful if you are targeting local businesses or a specific region.
Engagement Metrics
Engagement metrics measure how people interact, or engage, with your website content. Understanding user behavior can help you determine places in the website that might not be connecting with your audience and can give you opportunities to make adjustments. If your engagement numbers are low, it could mean that navigation is confusing and visitors aren’t finding what they want on your site. Important engagement metrics include:
Time on Page: Average time a user spends on each page.
Bounce Rate: Percentage of visitors who left your website after only viewing one page, rather than clicking on other pages.
Exit Rate: The percentage of visitors who leave a specific page.
Pages per Session: How many pages visitors view in one visit.
Conversion Metrics
Conversion metrics show if your visitors are taking the actions you want. A conversion on your site means that your website visitor did something you wanted them to do, like clicking a button, downloading a form, or making a purchase. Examples metrics include:
Contact Form Submissions
Button Clicks
Newsletter Signups
Purchases or bookings
Downloads of guides or lead magnets
Tools to Track Your Website Analytics
Once you know what to measure, you need tools to help you track your website analytics.
Built-in Analytics: Platforms like Squarespace offer integrated dashboards for traffic and engagement. Their integrated options are useful to manage your website and analytics in one place.
External Tools: Google Analytics, Hotjar, and other tools give deeper insight into session duration and conversion paths, and heatmaps.
AI-Powered Tools: New AI platforms automatically flag trends and even suggest improvements. DesignRush featured digital marketing trends in their new article, testing top AI analytics tools that are shaping how businesses monitor and optimize website performance. Read their insights here to see if any of the tools could be useful for your business.
How to Utilize These Insights
Collecting analytics is only the first step. Interpreting and acting on them is what drives results. Unfortunately, knowing your bounce rate is low isn’t enough to fix it, but there are actionable steps once you have found your website data. Even small changes based on your web insights can improve user experience and conversions. For example:
Adjusting menus or navigation for easier flow
Highlighting well-performing pages and services to increase engagement
Testing new layouts and CTAs to improve conversions.
It is important to track the impact of each change so you can continue optimizing.
Feeling Overwhelmed?
Tracking and managing these analytics can feel daunting for a small business owner who is already wearing more hats than they likely signed up for. If you are interested in building a website that not only looks great but performs at its best, let Solazzo Designs be your partner to help you track, interpret, and leverage the right analytics for your business growth. Contact us today to learn more.
